Join us for our next exciting GRIDtalk webinar, where we will be joined by Stephen Rose, Head of Completions and Commissioning at SSE Renewables. Stephen will be joined by Method Grid Head of Professional Services Pip Morpeth and they will be providing insight into offshore wind farm projects and the Method Grid and SSE Renewables […]
Introducing our new grid scheduling engine and Gantt charts for project delivery.
Your grids now have a full date scheduling engine and Gantt chart. This new way of scheduling dates includes significant changes to the way dates currently work in your grids and has involved the migration of your existing due dates into the new scheduling engine. Please read the pre-release notes here to fully understand these changes and the migration of your due dates.
You also have the option to use dependencies, lead/lag time and constraints.
The Gantt start of the week is Monday.
The Gantt schedules based on a 7 day working week.
You do not have to use the Gantt chart for date scheduling, you can continue to change dates within the grid to manage all your end dates (due dates). Date changes in the grid will automatically schedule items for you by setting a must finish on constraint. Learn more here.
Members with view access can view the Gantt, members with edit/manage access can edit the Gantt.
When you clone master grids to delivery grids they will retain any durations and dependencies you have set. This enables you to build your master grids with your durations and dependencies in place, once cloned to a delivery instance, you simply set the grid start date and the scheduling engine will do the rest.
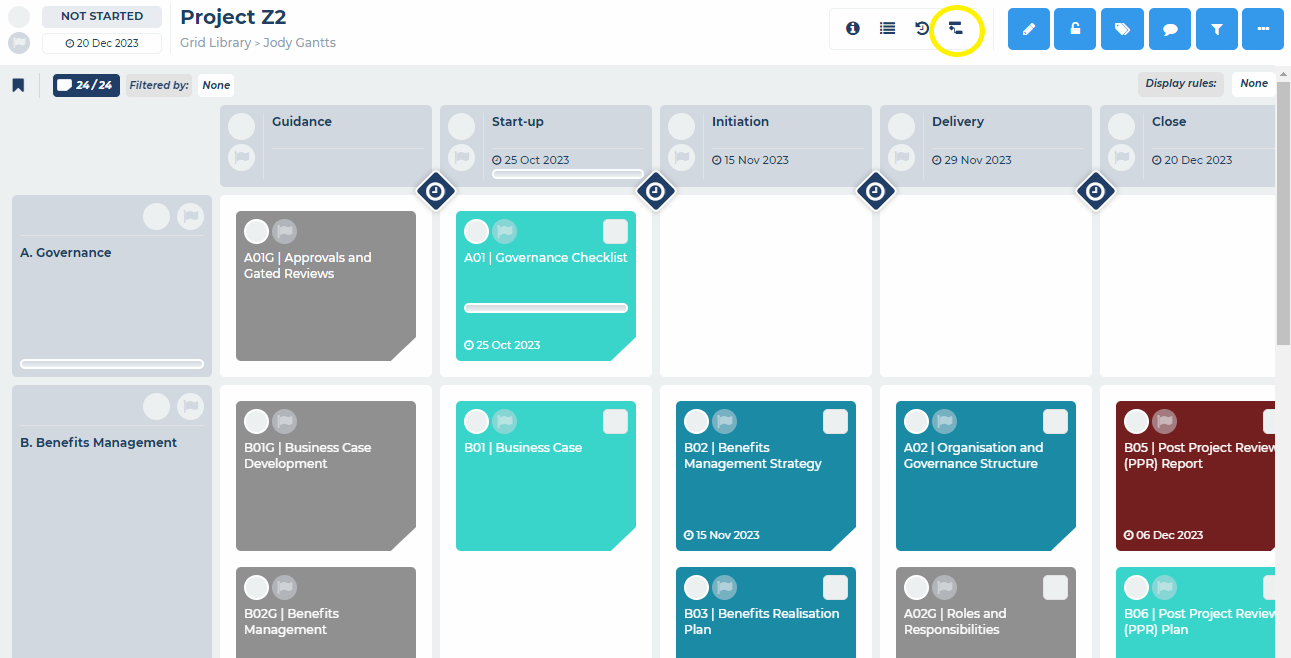
Opening the Gantt
To use the Gantt in your grid, simply select the Grid Gantt button in your grid tool shortcuts:
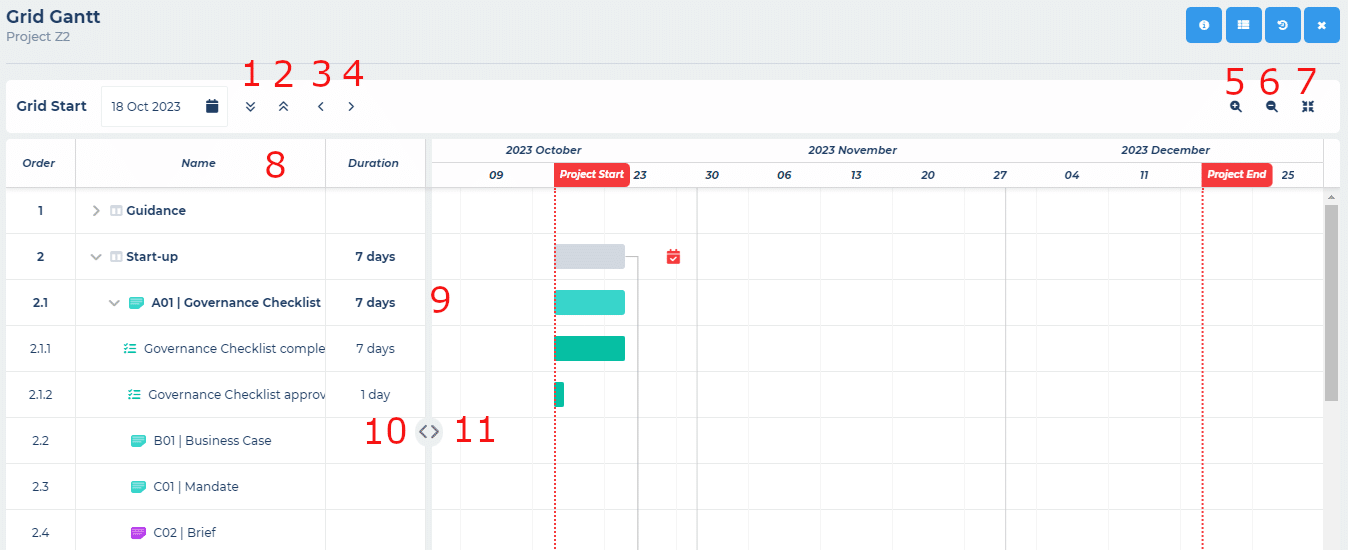
Viewing the Gantt
The Gantt view consists of the Gantt viewing tools (buttons) at the top, the Gantt table to the left (in which you can edit the scheduling data if you have edit/manage access to the grid) and the Gantt chart to the right. When viewing the Gantt you have a number of tools available to help you control what you see:
Expand all the sub items (stages > elements/gates > tasks) so they are all in view.
Collapse all the sub items (stages > elements/gates > tasks) so they are all minimised.
Scroll the Gantt chart to the previous time frame. You can also scroll the Gantt area using your mouse/touch.
Scroll the Gantt chart to the next time frame. You can also scroll the Gantt area using your mouse/touch.
Zoom in the Gantt chart to show different time frames i.e. months, weeks, days etc. You can also zoom in/out by holding the Ctrl key and using the mouse wheel.
Zoom out the Gantt chart to show different time frames i.e. months, weeks, days etc. You can also zoom in/out by holding the Ctrl key and using the mouse wheel.
Zoom to fit the Gantt chart will zoom the Gantt chart so it shows all the items across the timeline in the available screen area.
Clicking the table column headings will sort the table and the Gantt chart in ascending/descending order for that data column. Note that this does not change the order of any items within the grid view.
Separates the Gantt table from the Gantt chart, drag this bar as required to view these side-by-side. See 10 and 11 below if you want to quickly show/hide the table/chart.
Clicking the left arrow on the bar will hide the Gantt table and just show the Gantt chart.
Clicking the right arrow on the bar will hide the Gantt chart and just show the Gantt table.
Scheduling Engine
The Gantt scheduling engine now drives all date scheduling in your grids. You can however continue to assign end dates (due dates) to items within the grid.
Scheduling in the Grid
As always, only members with edit/manage access to a grid can schedule items.
You assign end dates in the grid in the same way as before. Simply assign the date and the scheduling engine will then apply the date you set as the date that item “must finish on”, this will in turn then set the duration to zero days (unless you have already set a duration, in which case it will retain this duration) and the start/end dates to the date you have set. This will essentially schedule everything for you as before. The only significant change is that you can no longer set an element, stage gate, stage or grid date beyond the furthest end date of their subordinate items. Please read the pre-release notes here to fully understand these changes and the migration of your due dates.
If you wish to do more advanced scheduling, we recommend that you do this all within the Gantt view for a more holistic overview of your project scheduling.
Scheduling in the Gantt
As always, only members with edit/manage access to a grid can schedule items.
The Gantt view provides you with a full Gantt scheduling engine for your grid, this will be familiar to anyone that has used a Gantt before. At the top of the Gantt view you can set the grid start date. Once set, this will automatically schedule any items with durations to start on this date. You can adjust this for any items as required by changing the dates, adding dependencies or using constraints.
To edit the items in the Gantt, you have a number of options and you can use whichever you prefer:
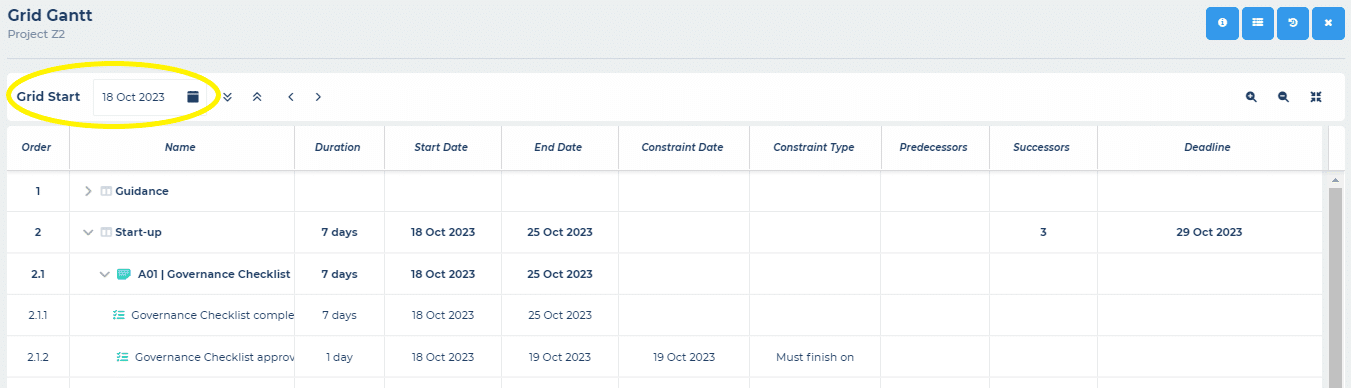
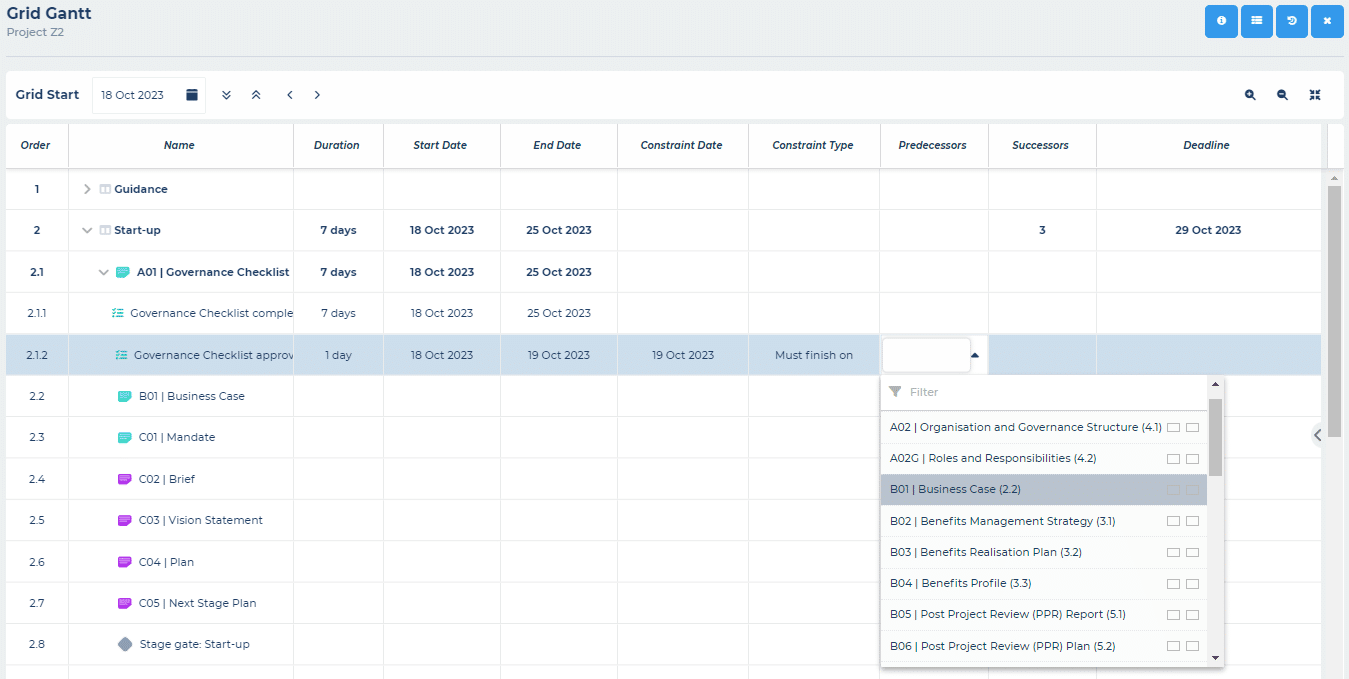
Gantt Table
The Gantt table shows all the scheduling data for each item in your grid. To edit an item, simply double click on the cell you want to edit and you can either type in the required data or use the dropdown interface that appears:
In the Gantt table, you can also click the table column headings and this will sort the table and the Gantt chart in ascending/descending order for that data column. Note that this does not change the order of any items within the grid view.
Gantt Chart
As well as providing the visual Gantt overview, you can also edit items in the Gantt chart:
Dependencies can be set by dragging the line from one item to the other:
Durations can be set by dragging the end of the item along the timeline:
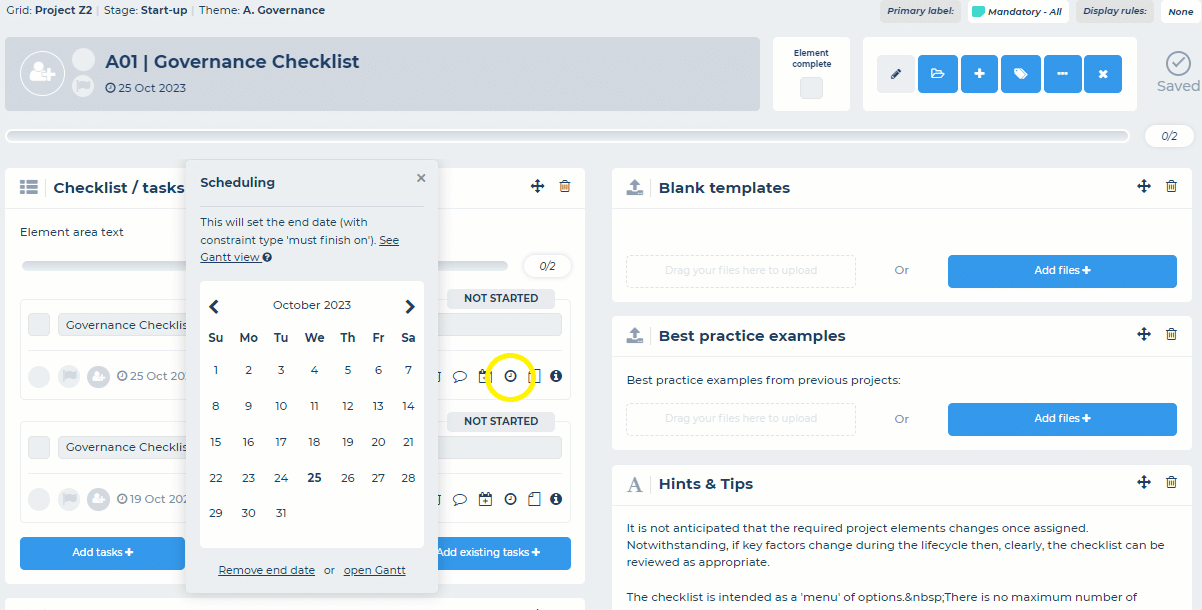
Scheduling Dialogue
To open the scheduling dialogue for any item, either right click on the item in the Gantt table and select edit, or double click on the item in the Gantt chart:
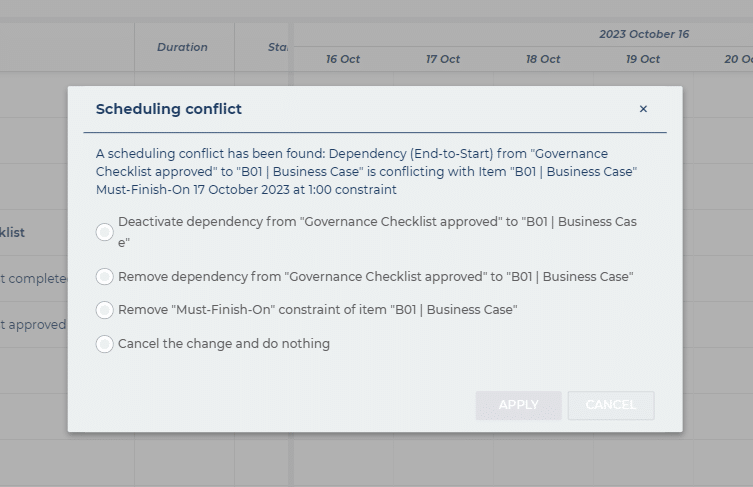
Scheduling Conflicts
Project scheduling and the Gantt will be as simple or as complex as your project demands. With more complexity i.e. dependencies, lead/lag times, constraints etc. the scheduling engine will sometimes detect scheduling conflicts. When scheduling conflicts are detected, the engine will prompt you to resolve these in a simple interface with the conflict detected clearly explained and your options for resolving the conflict presented to you for selection:
Learn more
We have covered the very basics of using the Gantt feature here. If you would like to learn more, we will be running a Gantt webinar with a full Q&A session on Thursday 16th November 2023 at 1pm. You can watch the recording of this webinar here. If you would like to schedule a training session with our customer success team, please contact us. You can also visit our help site to discover all the Gantt features.
Feedback
If you have any feedback or questions relating to this feature, please get in touch.
What’s next?
We will be adding the ability to download a PDF of your Gantt chart for distribution and printing. You can see all of our upcoming releases in our product roadmap.
For decades, organisations have heavily invested in codifying complex processes into static content such as PDFs, PowerPoint presentations, and SharePoint...